Loyal readers! Thanks for sticking with me. Thanksgiving, life, and bad data from King County Public Health are why you haven’t heard from me in a while. But King County FINALLY updated their data yesterday, so we can do some actual analysis.
I was very interested to see movement, if any, in infections, hospitalizations, and deaths, and how would the model adjust to account for the impact of the governor’s new directives.
Here’s the standard 5th-order polynomial model that has held up quite well over the past few months.
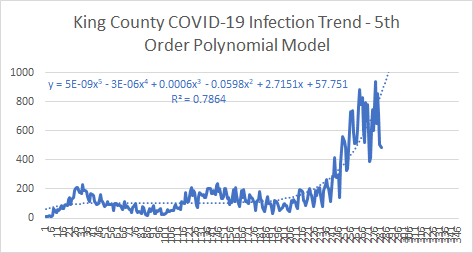
A couple observations:
- The model is still pretty strong with an r-squared of 0.78.
- The curve is still very steep moving into the future
- When you go back to waves 1 and 2 in the spring and summer, the model’s predictive curves have flattened out. While the r-squared is still strong, the model doesn’t *seem* to hold up as well with that old data.
Now, I mentioned I’d be building a second model in the background just in case the model breaks (which it didn’t), but it turns out that with the Governor’s new mandates, it is more predictive. Here’s the 6th order polynomial regression model:
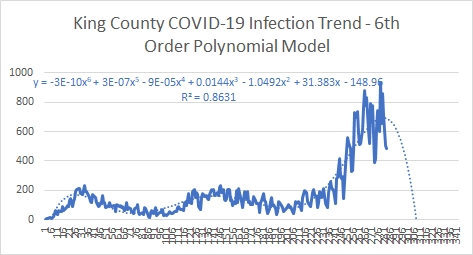
A couple observations here:
- VERY strong r-squared at 0.86
- Curves look solid during wave 1 and 2
- We’ve reached an inflection point, and infections should start to decrease
And we have seen infections level off. Here’s the monthly trend – basically flat:
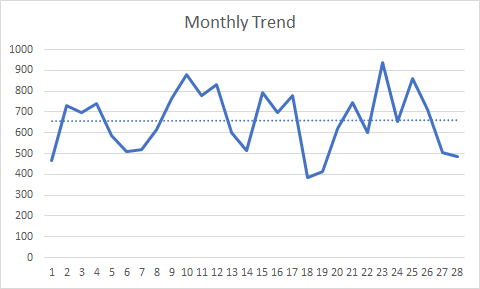
What can you take away from this data and analysis:
- The Governor’s order caused infections to level-off
- The most predictive model calls for infections to decline pretty rapidly
- We’ll see what actually happens
Ok, let’s move to hospitalizations and deaths.
If you remember last month, the hospital model flipped back and forth between following infections and not, and the r-squared was much lower. Now? More of the same:
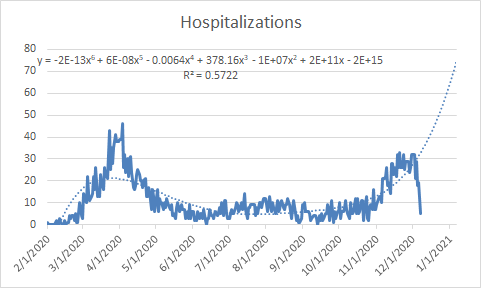
That curve looks scary. But the model doesn’t really fit with a low r-squared.
We’re averaging 29 hospital admits per day in King County. Is that a lot? I’m not the right person to answer that question. If you assume a 14-day stay in the hospital for COVID, that would mean there are currently 406 people being treated in the hospital for COVID. With over 4,000 hospital beds in King County, that means about 10% of the beds are taken up by COVID patients. With traditional occupancy of hospital beds in the 80% range and no admits for cold/flu, it seems like we’re in range. However, ICU beds or other critical care that is needed may be another story. I defer to the hospitals to make that call.
Hospitalizations generally trend well with infections, so with infections flat, it’s possible that hospitalizations stay at this level for some time.
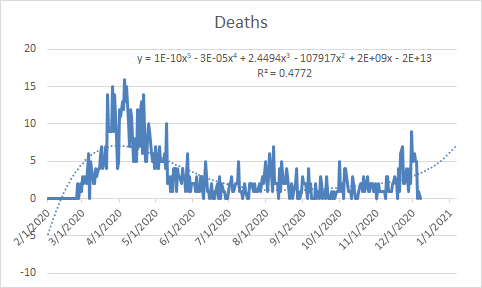
What about deaths:
We’re averaging about 5 per day over the past two weeks, which is tragic, and is also still a very low number. The model is weak here too – shows a slight increase coming in the next month.